
Swan-Ganz Calculator
1
Enter measured values
Hemodynamic Inputs
1Patient & Lab Data
cm
kg
m²
g/dL
%
%
2Systemic Arterial Pressure
mmHg
mmHg
mmHg
3PA Catheter
mmHg
mmHg
mmHg
mmHg
mmHg
L/min
2
Primary display: Fick
Calculated Hemodynamics
Flow and Perfusion
Cardiac OutputCO
--L/min
Reference: 4–6 L/min
Cardiac IndexCI
--L/min/m²
Reference: 2–4 L/min/m²
Venous SaturationSvO₂
--%
Reference: 65–75%
Cardiac Power OutputCPO
--W
Severe LV dysfunction concern below 0.6 W
Filling Pressures
Right Atrial PressureRAP
--mmHg
Reference: 1–6 mmHg
Wedge PressurePCWP
--mmHg
Reference: 6–11 mmHg
RA to PCWP RatioRAP/PCWP
--
Reference: <0.6 · >0.8 suggests RV-predominant congestion
PA PressureS/D/M
--mmHg
Displayed as systolic/diastolic/mean
Vascular Resistance and RV Function
Systemic Vascular ResistanceSVR
--dyn·s/cm⁵
Reference: 900–1400
Pulmonary Vascular ResistancePVR
--WU
Reference: ≤2 WU · >2 WU is elevated
PA Pulsatility IndexPAPi
--
Reference: >0.9 · <0.9 suggests severe RV dysfunction
Transpulmonary GradientTPG
--mmHg
mPAP − PCWP · >12 suggests pulmonary vascular remodeling
3
Hemodynamic Interpretation
Swan Interpretation
Right Heart Cath Patterns
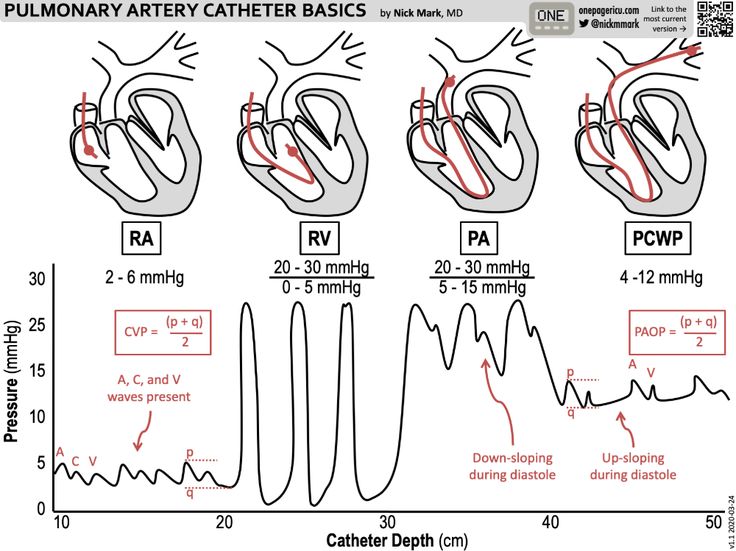
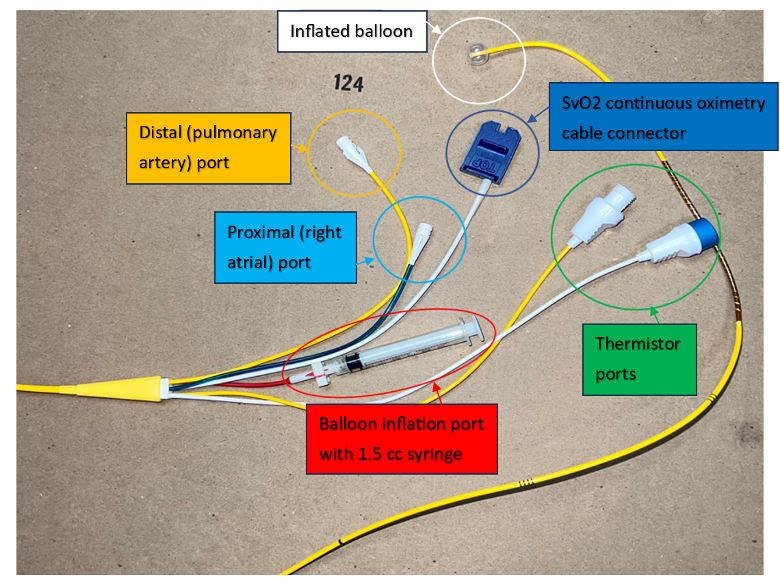
Swan Basics
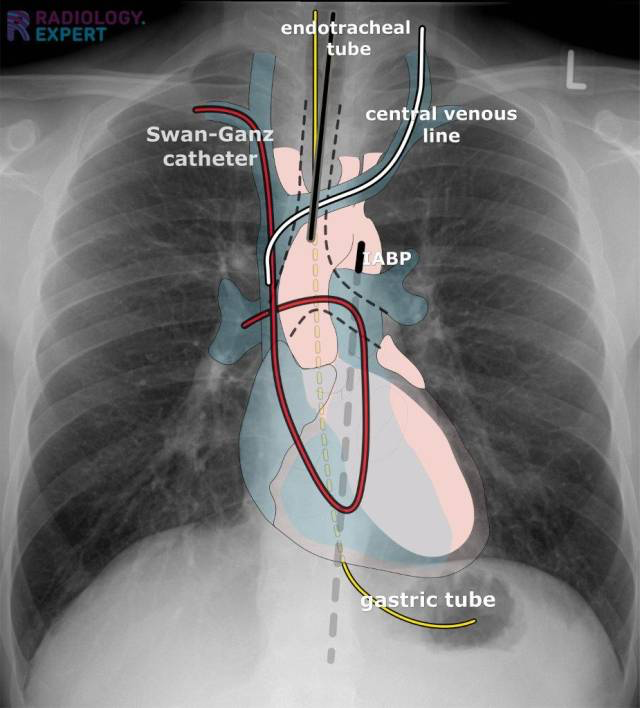
CXR Placement
- Path: SVC → RA → RV → PA → branch
- Ideal tip: Proximal R/L pulmonary artery, ~3–5 cm beyond carina, near hilum
- Too proximal: In RV → arrhythmia risk
- Too distal: In segmental PA → rupture risk
Right Heart Cath Equations
Flow & Perfusion
| Metric | Equation | Units |
|---|---|---|
| BSA | √[(Ht × Wt) / 3600] | m² |
| Fick CO | VO₂ / (CaO₂ − CvO₂) | L/min |
| Estimated Fick CO | (125 × BSA) / [(SaO₂ − SvO₂) × 1.36 × 10 × Hgb] | L/min |
| CI | CO / BSA | L/min/m² |
| CPO | (MAP × CO) / 451 | W |
Pressure & Gradients
| Metric | Equation | Units |
|---|---|---|
| MAP | (SBP + 2 × DBP) / 3 | mmHg |
| mPAP | (PASP + 2 × PADP) / 3 | mmHg |
| PA pulse pressure | PASP − PADP | mmHg |
| TPG | mPAP − PCWP | mmHg |
| DPG | PADP − PCWP | mmHg |
Vascular Resistance
| Metric | Equation | Units |
|---|---|---|
| SVR | [(MAP − RAP) / CO] × 80 | dyn·s/cm⁵ |
| SVRI | [(MAP − RAP) / CI] × 80 | dyn·s·m²/cm⁵ |
| PVR | (mPAP − PCWP) / CO | WU |
| PVRI | (mPAP − PCWP) / CI | WU·m² |
| WU → dyn | WU × 80 | dyn·s/cm⁵ |
RV Hemodynamics
| Metric | Equation | Units |
|---|---|---|
| PAPi | (PASP − PADP) / RAP | ratio |
| RAP/PCWP | RAP / PCWP | ratio |
| RV SWI | (mPAP − RAP) × SVI × 0.0136 | g·m/m²/beat |
| SV | (CO × 1000) / HR | mL/beat |
| SVI | SV / BSA | mL/beat/m² |
References
1
Swan HJC, Ganz W, Forrester J, Marcus H, Diamond G, Chonette D.
Catheterization of the heart in man with use of a flow-directed
balloon-tipped catheter.
N Engl J Med. 1970;283(9):447-451.
doi:10.1056/NEJM197008272830902.
View study
View study
Swan-Ganz Catheter
2
Forrester JS, Diamond G, Chatterjee K, Swan HJC.
Medical therapy of acute myocardial infarction by application
of hemodynamic subsets (first of two parts).
N Engl J Med. 1976;295(24):1356-1362.
doi:10.1056/NEJM197612092952406.
View study
View study
Hemodynamic Profiles
3
Stevenson LW, Perloff JK.
The limited reliability of physical signs for estimating
hemodynamics in chronic heart failure.
JAMA. 1989;261(6):884-888.
doi:10.1001/jama.1989.03420060100040.
View study
View study
Clinical Hemodynamics
4
Nohria A, Tsang SW, Fang JC, Lewis EF, Jarcho JA,
Mudge GH, Stevenson LW.
Clinical assessment identifies hemodynamic profiles that predict
outcomes in patients admitted with heart failure.
J Am Coll Cardiol. 2003;41(10):1797-1804.
doi:10.1016/S0735-1097(03)00309-7.
View study
View study
Warm / Cold · Wet / Dry
5
Fincke R, Hochman JS, Lowe AM, et al.
Cardiac power is the strongest hemodynamic correlate of mortality
in cardiogenic shock: a report from the SHOCK trial registry.
J Am Coll Cardiol. 2004;44(2):340-348.
doi:10.1016/j.jacc.2004.03.060.
View study
View study
Cardiac Power Output
6
Mendoza DD, Cooper HA, Panza JA.
Cardiac power output predicts mortality across a broad spectrum
of patients with acute cardiac disease.
Am Heart J. 2007;153(3):366-370.
doi:10.1016/j.ahj.2006.11.014.
View study
View study
CPO Prognosis
7
Korabathina R, Heffernan KS, Paruchuri V, et al.
The pulmonary artery pulsatility index identifies severe right
ventricular dysfunction in acute inferior myocardial infarction.
Catheter Cardiovasc Interv. 2012;80(4):593-600.
doi:10.1002/ccd.23309.
View study
View study
PAPi ≤ 0.9
8
Saxena A, Garan AR, Kapur NK, et al.
Value of hemodynamic monitoring in patients with cardiogenic
shock undergoing mechanical circulatory support.
Circulation. 2020;141(14):1184-1197.
doi:10.1161/CIRCULATIONAHA.119.043080.
View review
View review
Shock Hemodynamics
9
Bertaina M, Galluzzo A, Morici N, et al.
Pulmonary artery catheter monitoring in patients with cardiogenic
shock: time for a reappraisal?
Card Fail Rev. 2022;8:e15.
doi:10.15420/cfr.2021.32.
View review
View review
Pulmonary Artery Catheter
10
Humbert M, Kovacs G, Hoeper MM, et al.
2022 ESC/ERS Guidelines for the diagnosis and treatment of
pulmonary hypertension.
Eur Heart J. 2022;43(38):3618-3731.
doi:10.1093/eurheartj/ehac237.
View guideline
View guideline
Pulmonary Hypertension
11
Heidenreich PA, Bozkurt B, Aguilar D, et al.
2022 AHA/ACC/HFSA Guideline for the Management of Heart Failure.
Circulation. 2022;145(18):e895-e1032.
doi:10.1161/CIR.0000000000001063.
View guideline
View guideline
Heart Failure Guideline
12
Naidu SS, Baran DA, Jentzer JC, et al.
SCAI SHOCK stage classification expert consensus update:
a review and incorporation of validation studies.
J Soc Cardiovasc Angiogr Interv. 2022;1(1):100008.
doi:10.1016/j.jscai.2021.100008.
View SCAI consensus
View SCAI consensus
SCAI Shock Staging