Aortic Stenosis Severity
Resting TTE
Use the highest reproducible AV CW Doppler signal from multiple windows
Flow, velocity ratio, CT calcium
Low-Dose Dobutamine Stress Echo
Best suited to low-flow, low-gradient AS with reduced EF
Projected AVA at 250 mL/s
Aortic Stenosis Diagnostic Pathway
Peak velocity + mean gradient
Use the highest reproducible CW Doppler signal from multiple windows.
High-gradient severe AS
Vmax ≥4.0 m/s or mean gradient ≥40 mmHg supports severe AS when Doppler measurements are technically valid.
If AVA >1.0 cm², verify the discordanceIs AVA <1.0 cm²?
A small AVA despite a low velocity and gradient creates AVA-gradient discordance.
Severe AS not established
Vmax <4.0 m/s, mean gradient <40 mmHg, and AVA ≥1.0 cm² do not meet criteria for severe AS.
AVA <1.0 cm² + MG <40 mmHg
Verify that the discordance is real before classifying flow.
Verify common echocardiographic sources of error
Repeat the measurements first
Do not classify low-flow or normal-flow discordant AS until the Doppler and continuity-equation measurements are reliable.
What is the stroke volume index?
SVI separates low-flow from normal-flow AVA-gradient discordance.
AVA <1.0 + MG <40 + SVI >35 mL/m²
Use non-contrast CT aortic valve calcium scoring to adjudicate severity.
What is the LVEF?
This separates classic from paradoxical low-flow, low-gradient AS.
AVA <1.0 + MG <40 + SVI ≤35 + LVEF <50%
Low-dose dobutamine stress echo distinguishes true severe from pseudo-severe AS.
AVA <1.0 + MG <40 + SVI ≤35 + LVEF ≥50%
Use non-contrast CT aortic valve calcium scoring to adjudicate severity.
How do AVA and mean gradient respond?
Interpret the valve at increased transvalvular flow.
Pseudo-severe AS
AVA increases to ≥1.0 cm² while mean gradient remains <40 mmHg with increased flow.
Severe AS
AVA remains <1.0 cm² while mean gradient rises to ≥40 mmHg with increased flow.
DSE remains discordant
If flow increases enough, calculate projected AVA. If augmentation is inadequate, use CT calcium scoring.
Projected AVA at standardized flow
Estimate AVA at a standardized transvalvular flow rate of 250 mL/s.
AVAproj <1.0 cm² supports severe ASSevere AS
Projected AVA remains <1.0 cm² at standardized flow.
Pseudo-severe AS
Projected AVA is ≥1.0 cm² at standardized flow.
Is the calcium score above the severe threshold?
Men ≥2000 AU · Women ≥1200 AU
Severe AS
CT calcium burden supports anatomically severe aortic stenosis.
Non-severe AS
CT calcium burden is below the severe-AS threshold.
Aortic Valve Anatomy + ACC/AHA Staging
The normal aortic valve has 3 thin cusps. Normal valve area is roughly 3–4 cm², with about 2 cm leaflet opening in systole.
Examples: BAV, aortic sclerosis, prior rheumatic disease
Early calcification/fibrosis
Usually normal EF and no AS symptoms
Congenital Valve Morphology
Congenital Valve Morphology
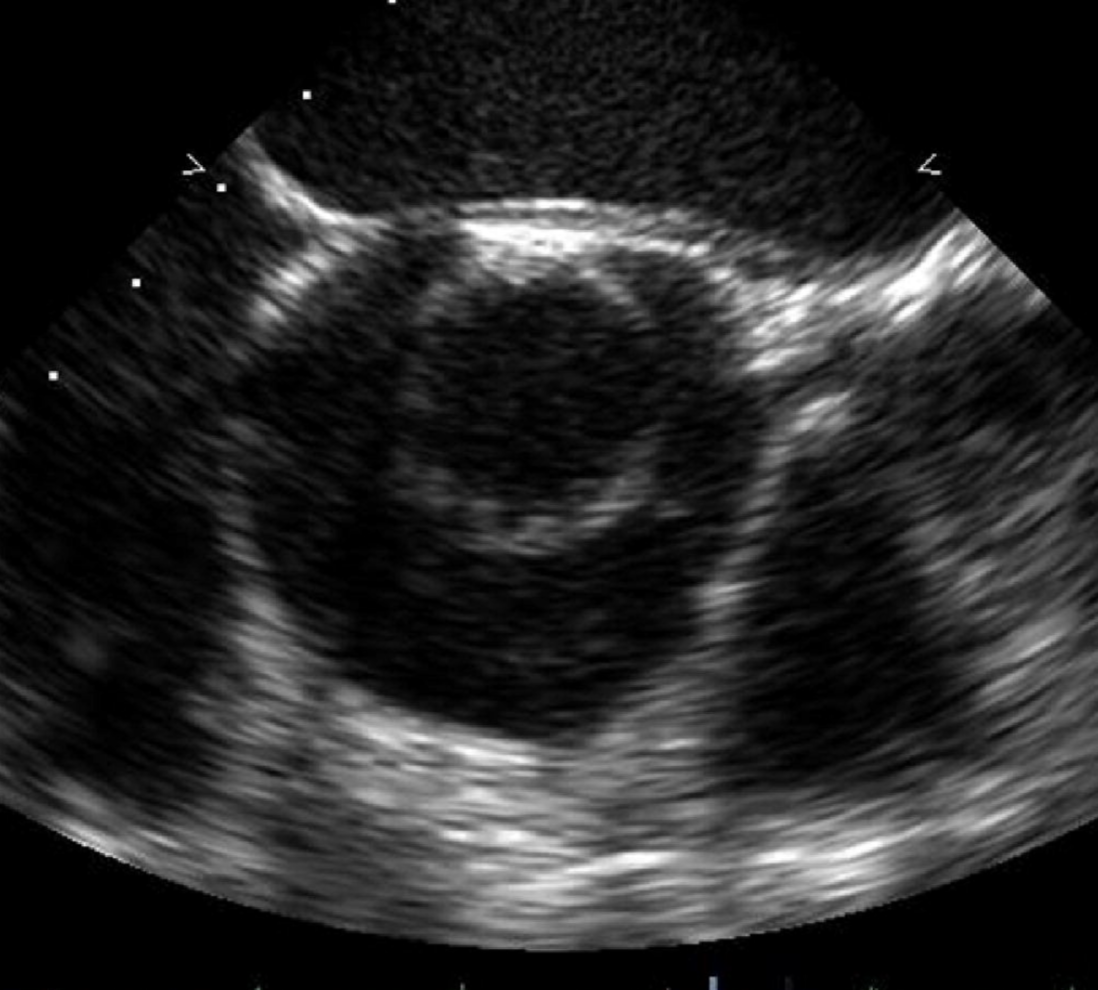
Unicuspid
Rare congenital valve that usually presents with stenosis
- Very rare
- Usually causes AS
- AR is less common
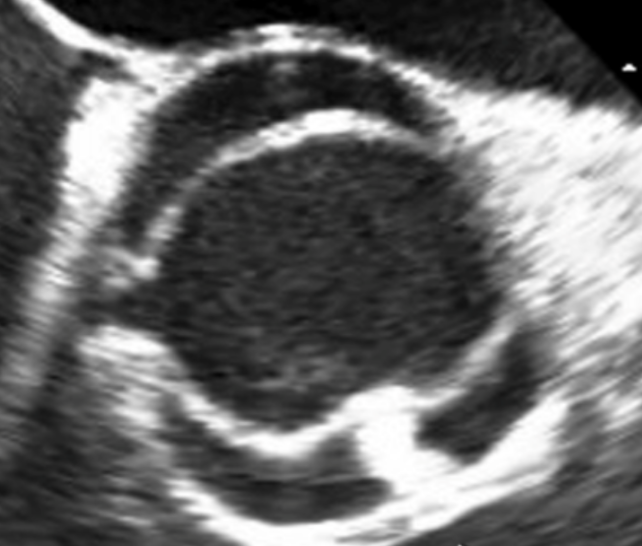
Bicuspid
Most common congenital aortic valve abnormality
- ~1–2% of the population
- AS more common than AR
- Screen first-degree relatives
- Common pattern: right-left cusp fusion
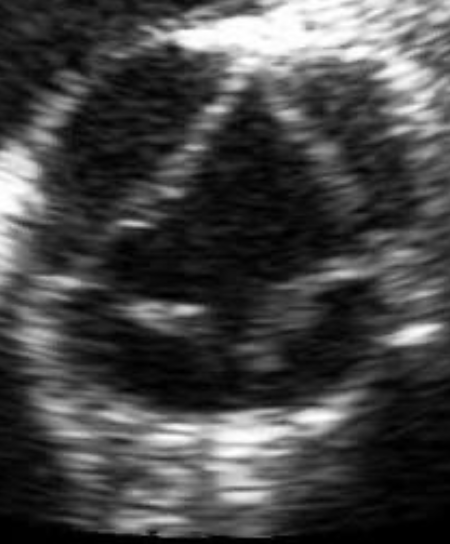
Quadricuspid
Rare congenital morphology that more often causes regurgitation
- AR more common than AS
- May coexist with other congenital lesions
How to Quantify Aortic Stenosis on Echo
- The primary things you are looking for are peak AV velocity, mean gradient, AVA and flow
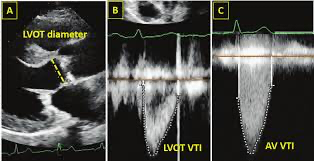
- The continuity equation which is used to measure the AVA depends on three measurements
- LVOT diameter
- LVOT VTI
- AV VTI
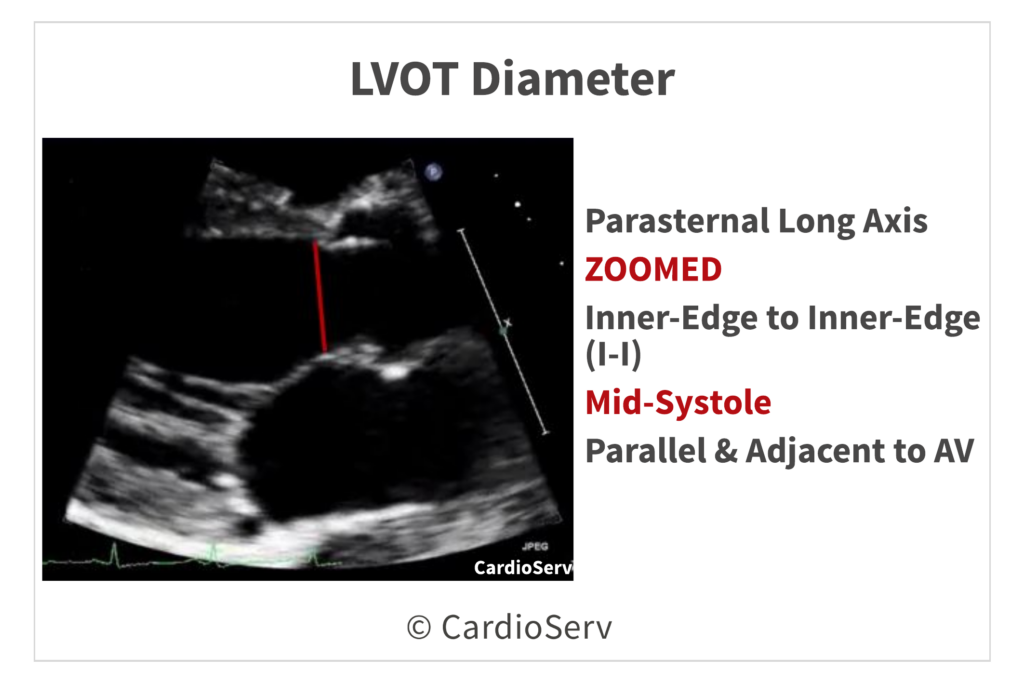
LVOT Diameter · PLAX
- PLAX view, zoom on AV + LVOT
- Measure in mid-systole with valve open
- Inner-edge to inner-edge
- LVOT area = 0.785 × diameter²
- Diameter error is amplified because the value is squared
- Recommend comparing the measured LVOTD with the predicted LVOTD by using the following formula
- Predicted LVOTD = (5.7 × body surface area) + 12.1
- This is integrated into my calculator above if discordance arises
- Recommend comparing the measured LVOTD with the predicted LVOTD by using the following formula
LVOT Diameter Check
Quick check for AVA–mean gradient discordance
Measurements
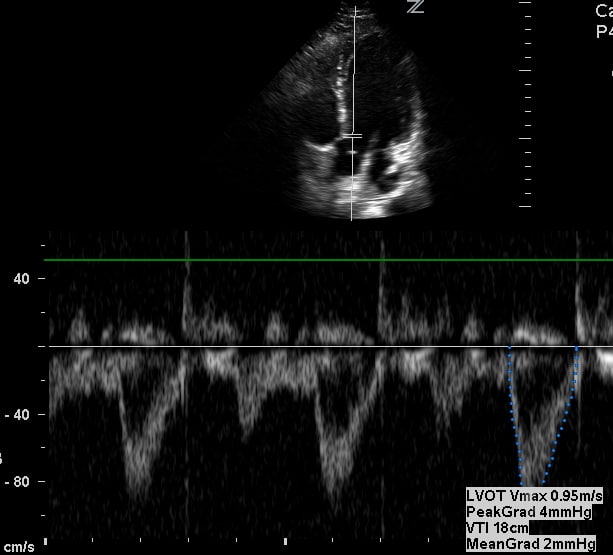
LVOT VTI · PW Doppler
Represents forward stroke flow before the stenotic valve.
- Apical 5-chamber or 3-chamber
- PW Doppler
- Sample just proximal to flow acceleration, usually ~0.5–1.0 cm below the valve
- Trace the modal velocity envelope
Aortic Valve VTI + Vmax · CW Doppler
- CW Doppler through the stenotic valve
- Use multiple windows: apical 5C, apical 3C, right parasternal, suprasternal when useful
- Use the highest reproducible velocity
- Trace the full systolic envelope for Vmax, mean gradient and AV VTI
Aortic Valve Area · Continuity Equation
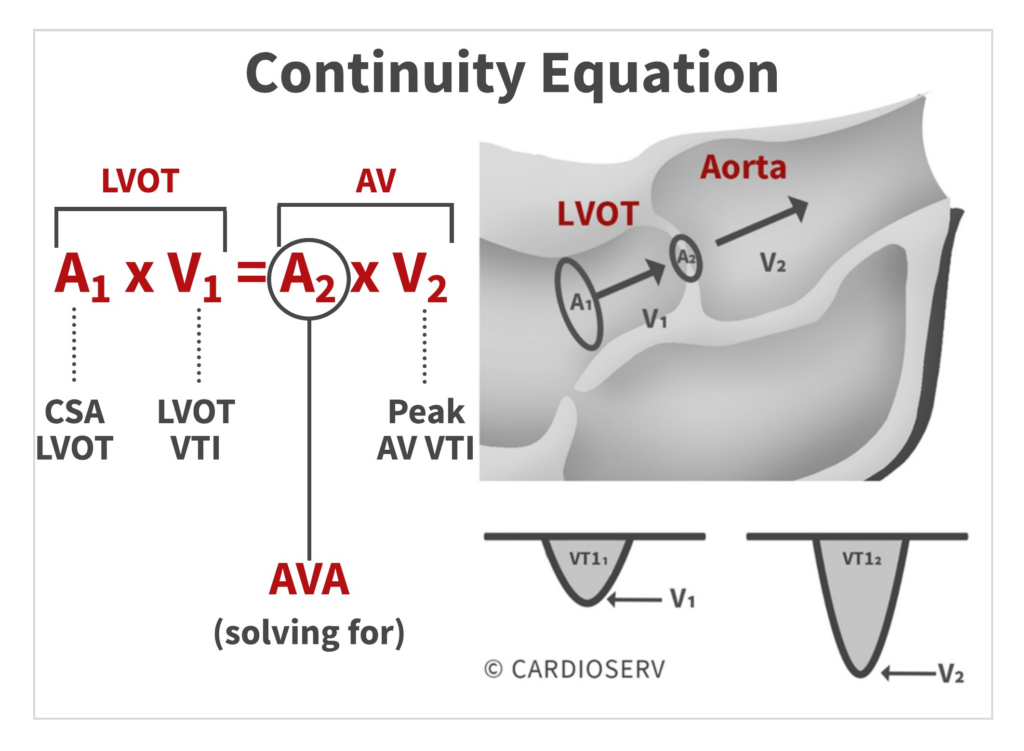
AVA = (LVOT area × LVOT VTI) ÷ AV VTI
- LVOT area = π × (LVOT diameter ÷ 2)²
- Continuity assumes flow entering the valve equals flow across the valve
- Planimetry can be used, but TEE or CT generally defines the orifice better when transthoracic imaging is limited
Continuity Equation
Flow entering the LVOT = flow crossing the AV
Dimensionless Index
DI = LVOT VTI ÷ AV VTI
- ≤0.25 supports severe AS
- Useful when LVOT diameter is uncertain because diameter is not part of the calculation
Severity Grading
| Severity | AVA | Mean Gradient | Vmax |
|---|---|---|---|
| Mild | >1.5 cm² | <20 mmHg | <3.0 m/s |
| Moderate | >1.0–1.5 cm² | 20–39 mmHg | 3.0–3.9 m/s |
| Severe | ≤1.0 cm² | ≥40 mmHg | ≥4.0 m/s |
When the Numbers Disagree
- Vmax ≥4 m/s or mean gradient ≥40 mmHg with AVA slightly >1 cm²: treat the hemodynamics as severe AS and recheck why AVA is discordant
- AVA ≤1 cm² but Vmax <4 m/s and mean gradient <40 mmHg: first think measurement error or low-flow physiology
- Recheck the CW Doppler window, LVOT diameter and LVOT PW sample location before calling low-gradient severe AS
- Then define flow with SVI and EF
1 · Measurement error
Suboptimal CW alignment can underestimate Vmax/MG. A small LVOT diameter can markedly underestimate calculated AVA.
2 · Define flow
Low flow: SVI <35 mL/m². Then use EF to separate classic from paradoxical low-flow AS.
3 · Use a tie-breaker
Dobutamine stress echo for classic LFLG. CT calcium is especially useful when preserved EF or inconclusive DSE leaves uncertainty.
Low-Flow, Low-Gradient Aortic Stenosis
D2 · Classic LFLG
D3 · Paradoxical LFLG
Dobutamine Stress Echo - Is it the valve or the ventricle?
- Is the valve truly fixed and severe, or does it open when the ventricle generates more flow?
- Low-dose dobutamine: start around 5 mcg/kg/min and increase in 5-minute stages up to 20 mcg/kg/min
- Flow reserve: stroke volume increase ≥20%
- True severe: AVA stays ≤1 cm² while Vmax/mean gradient rises into the severe range
- Pseudo-severe: AVA increases >1 cm² while gradient remains <40 mmHg
- If achieved flow is still inadequate, projected AVA at 250 mL/s can help
Once true severe AS is confirmed, the next question is whether symptoms or LV dysfunction establish an indication for aortic valve replacement.
Special Situations
Atrial fibrillation
- Beat-to-beat variation changes flow and transvalvular gradients
- Average at least 5 representative Doppler beats
High arterial afterload
- High afterload can reduce forward flow and diminish the gradient
- Valvuloarterial impedance estimates total LV systolic load
- Zva = (systolic BP + mean AV gradient) ÷ SVI
Look above and below the valve
- Subvalvular: fixed subaortic membrane or dynamic LVOT obstruction can alter the Doppler profile
- Valvular: usual calcific/congenital aortic stenosis
- Supravalvular: congenital narrowing above the valve, classically associated with Williams syndrome
View ASE/EACVI recommendations
View ACC/AHA guideline
View ESC/EACTS guideline
View review
View study